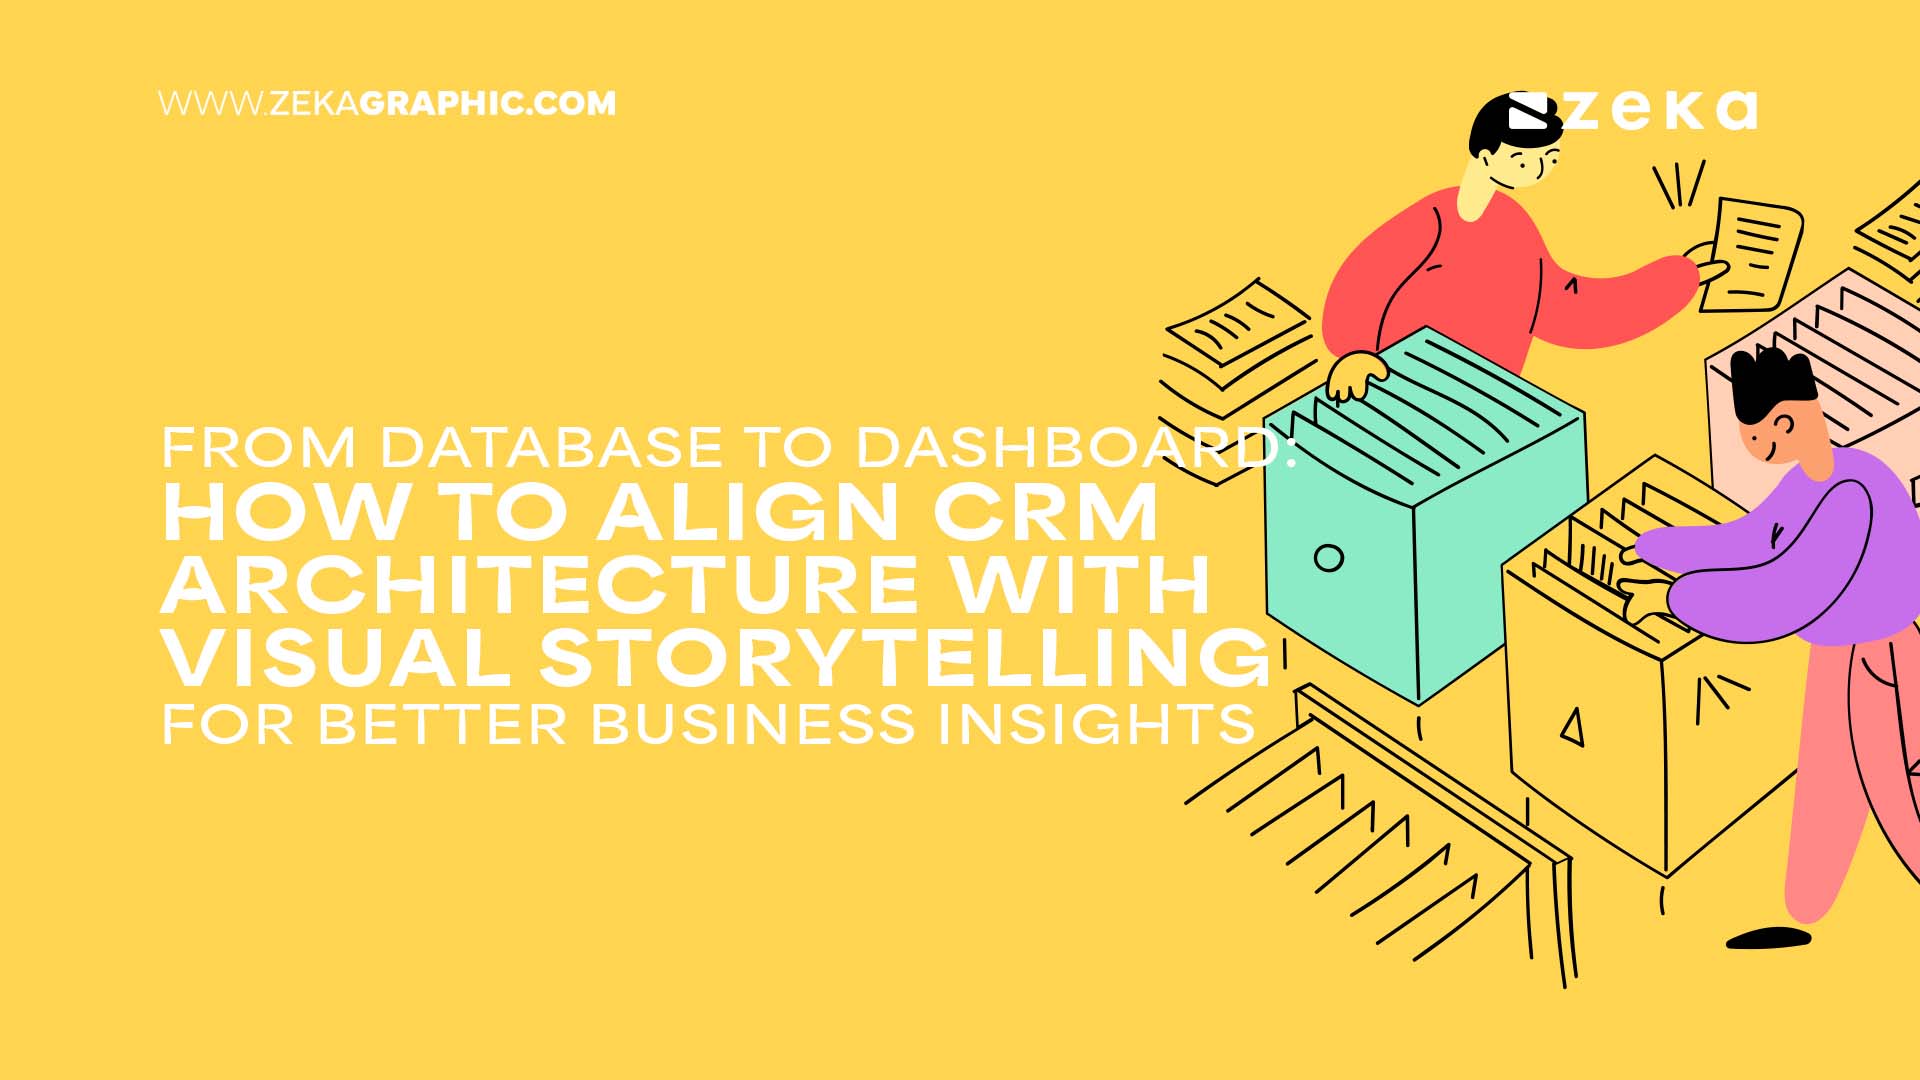
CRM systems today generate more data than ever – customer behavior, sales activity, support tickets, and lifecycle metrics flood in by the second. Yet despite this abundance, decision-makers often find themselves sifting through disjointed reports or waiting on technical teams to translate complex datasets into actionable insights. The disconnect? Most CRM architectures are built for data storage and workflows, not for storytelling.
In high-growth organizations, where rapid decisions define competitive advantage, this gap can cost time, clarity, and market share. Executives want answers, not raw data. Sales managers need to see performance shifts at a glance. Marketing leads expect ROI snapshots they can trust. But without a deliberate link between backend data structure and frontend dashboard design, these expectations remain unmet.
This article breaks down how to align CRM architecture with visual storytelling principles – from designing databases that support dynamic querying, to structuring dashboards that highlight business-critical narratives. Whether you’re scaling a SaaS CRM, managing custom ERP integrations, or leading a data-informed product team, you’ll learn how to build systems that do more than store data – they tell a story your stakeholders can act on.
Advertisment
Effective CRM dashboards don’t begin with design – they begin with structure. When the underlying CRM architecture is fragmented or overly complex, even the most advanced visualization tools will struggle to surface relevant, accurate insights. Structuring your CRM to support future data storytelling means creating a logical, query-optimized environment that maps cleanly to how decision-makers consume information.
Key architectural elements to consider include:
This foundation allows visualizations to work with – not against – the data model, enabling more agile reporting and cross-functional transparency.
One of the most common mistakes in CRM system design is treating reporting as an afterthought. When dashboards are layered onto rigid or siloed architectures, teams often resort to data exports and manual workarounds – defeating the purpose of real-time insight delivery.
To prevent this, CRM architects must work closely with stakeholders to anticipate the questions dashboards will need to answer. This means designing systems not just for operational workflows, but also for analytical flexibility. Thoughtful schema design, relational consistency, and modular data hierarchies all contribute to a CRM that visualizes cleanly and scales with business complexity.
Translating business logic into a CRM system that supports both operational tasks and strategic analytics requires deep technical fluency. Skilled CRM developers understand how to architect databases, workflows, and API layers with visualization in mind from day one. Their experience is particularly critical when customizing CRMs for growing businesses that demand not only functionality, but insight at scale. Partnering with developers who design systems for both performance and transparency dramatically reduces the need for costly overhauls down the line.
Your dashboards are only as good as your data structure. By treating visualization as a downstream outcome of smart CRM architecture – and by involving CRM developers with analytics-aware thinking – you position your business to surface meaningful insights without delay, distortion, or dependency.
Advertisment
Once your CRM is architected for clean data flow, the next challenge is communicating insights effectively. A dashboard is not a report – it’s a decision-making tool. To be useful, it must guide the viewer through a clear, structured narrative that reflects key business objectives. Visual storytelling in CRM dashboards bridges the gap between data and action by framing metrics in context, highlighting trends, and prompting informed decisions.
Key principles of effective visual storytelling include:
Poor dashboards bombard users with charts; effective ones tell them where to focus and what to do next.
Generic dashboards dilute insight. A CFO, sales manager, and product lead require different lenses on the same data. Rather than creating a one-size-fits-all view, build role-specific dashboards that align with each stakeholder’s KPIs and decision-making needs.
For example:
Role-based views reduce noise and improve accountability by surfacing only what’s relevant to each decision-maker.
Static dashboards quickly become outdated or fail to answer follow-up questions. To keep decision-making fluid, empower users to explore data without technical intervention. Interactivity is essential – not a luxury.
Best practices include:
These features eliminate the need for ad hoc reporting requests and promote data self-sufficiency across departments.
A well-designed CRM dashboard isn’t just a data display – it’s a strategic interface. By applying principles of visual storytelling, tailoring insights by role, and enabling interactive exploration, businesses can turn their CRM into a true command center. The result: faster decisions, clearer priorities, and more confident execution.
Advertisment
Aligning CRM architecture with visual storytelling is no longer a strategic luxury – it’s a performance necessity. Organizations generate vast amounts of customer and operational data, yet without a framework that connects raw inputs to actionable narratives, the value of that data remains untapped.
To close this gap, companies must rethink how their CRM systems are built and presented:
Leaders aren’t looking for more reports – they’re looking for meaning. When the technical foundation is aligned with the cognitive process of decision-making, CRM data becomes a strategic asset rather than a reporting burden.
The most competitive teams don’t just collect data – they use it to tell the right story, to the right people, at the right time. Building that capability starts with architectural intent and ends with design precision. Everything in between must serve one goal: helping people make smarter decisions, faster.
Advertisment
Pin it for later!
If you found this post useful you might like to read these post about Graphic Design Inspiration.
Advertisment
If you like this post share it on your social media!
Advertisment

Want to make your Business Grow with Creative design?
Advertisment
Advertisment